PHC Group Environmental Impact Data
To comprehensively monitor and reduce the environmental footprint of our business activities, including our value chain, we calculate greenhouse gas (GHG) emissions for Scopes 1, 2, and 3 as defined by the internationally established GHG Protocol standards.
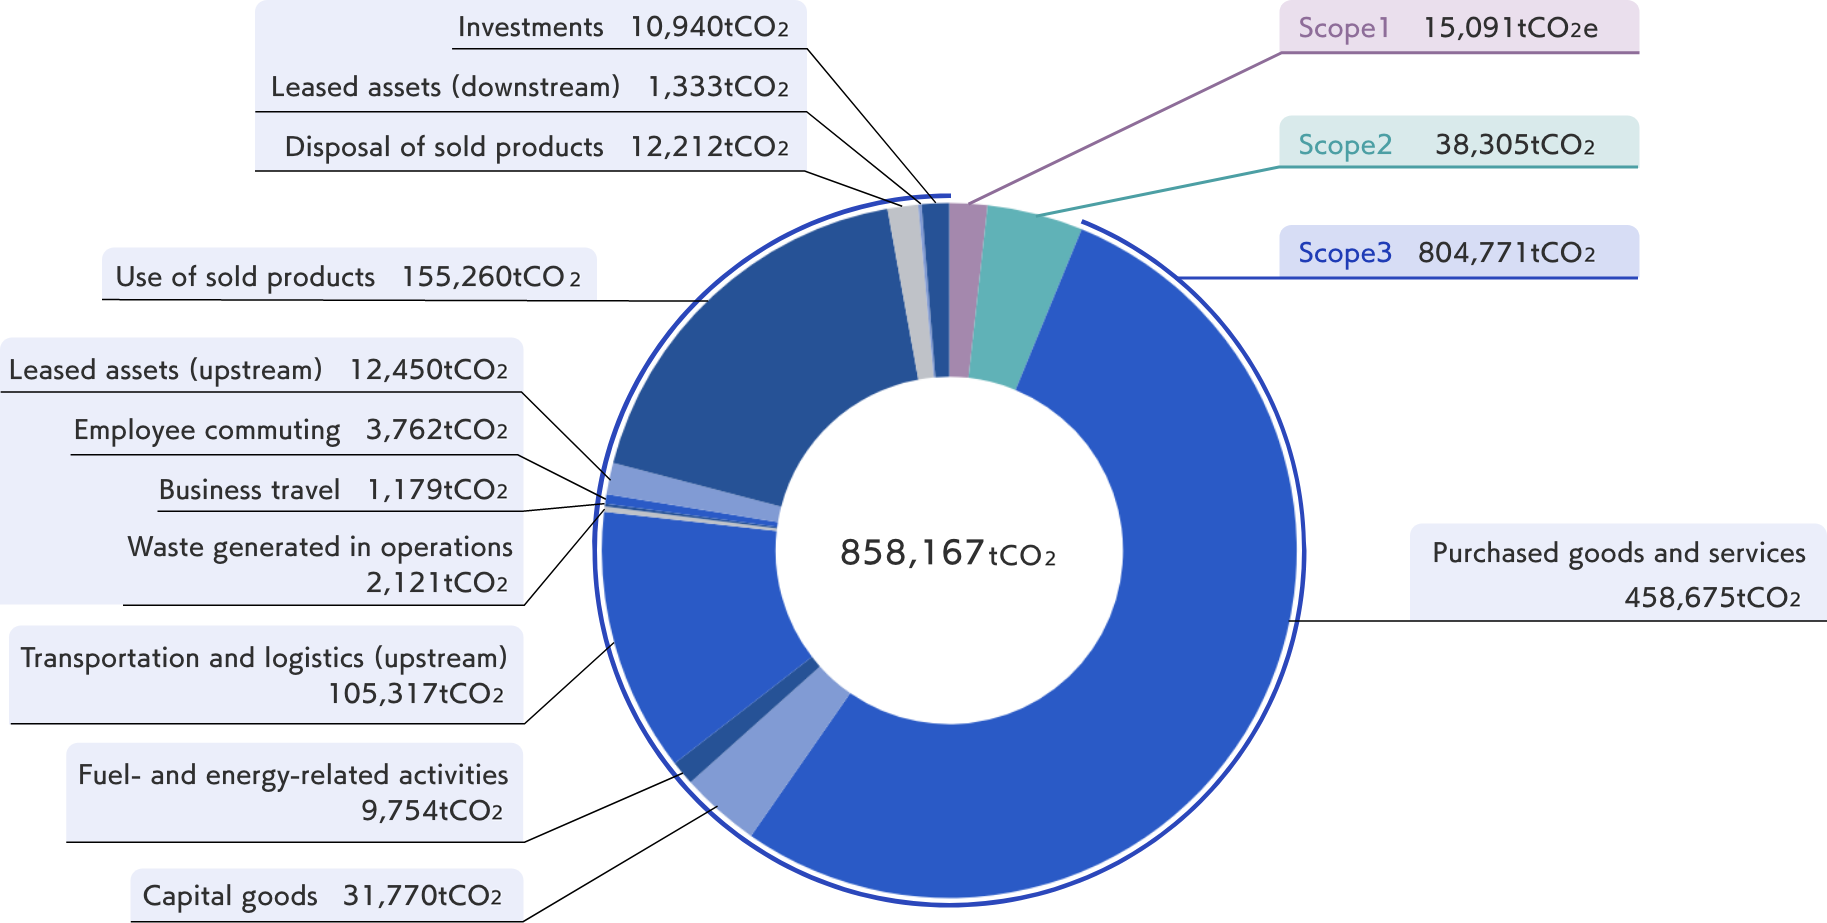
Proportion of GHG Emissions FY2024
GHG Emissions
| Scope |
Unit |
FY2023 Results
(Base Year) |
FY2024 Results |
| Scope 1 |
t-CO2e |
15,861 |
15,091 |
| Scope 2 (Location-based) |
t-CO2e |
38,293 |
38,305 |
| Scope 2 (Market-based) |
t-CO2e |
35,304 |
35,168 |
| Scope 3 |
t-CO2e |
793,687 |
804,771 |
| |
Category |
1 Purchased goods and services |
t-CO2e |
325,690 |
458,675 |
| |
2 Capital goods |
t-CO2e |
45,424 |
31,770 |
| |
3 Fuel- and energy-related activities |
t-CO2e |
8,924 |
9,754 |
| |
4 Transportation and logistics (upstream) |
t-CO2e |
195,103 |
105,317 |
| |
5 Waste generated in operations |
t-CO2e |
2,487 |
2,121 |
| |
6 Business travel |
t-CO2e |
1,205 |
1,179 |
| |
7 Employee commuting |
t-CO2e |
3,771 |
3,762 |
| |
10 Processing of sold products |
t-CO2e |
8,353 |
12,450 |
| |
11 Use of sold products |
t-CO2e |
176,898 |
155,260 |
| |
12 Disposal of sold products |
t-CO2e |
15,344 |
12,212 |
| |
13 Leased assets (downstream) |
t-CO2e |
1,558 |
1,333 |
| |
15 Investments |
t-CO2e |
8,931 |
10,940 |
Electricity Consumption
| Indicator |
Unit |
Actual Results for FY2023 |
Actual Results for FY2024 |
| Electricity Consumption |
MWh |
80,928 |
81,302 |
Waste Volume
| Indicator |
Unit |
FY2023 Results (*1) |
FY2024 Results |
| Waste Disposal Volume (including valuable materials) |
ton |
6,014 |
6,008 |
| |
Thermal Recycling |
ton |
2,007 |
1,783 |
| |
|
Waste Treated through Thermal Recycling |
ton |
- |
1,777 |
| |
|
Infectious Waste |
ton |
- |
6 |
| |
Landfill |
ton |
1,264 |
1,315 |
| |
|
Waste Treated through Landfilling |
ton |
- |
1,116 |
| |
|
Industrial Waste from Mercury‑Containing Products |
ton |
- |
0.4 |
| |
|
Specified Hazardous Industrial Waste |
ton |
- |
30 |
| |
|
Stable Mixed Waste |
ton |
- |
159 |
| |
|
Specially Controlled Flammable Waste Oil |
ton |
- |
2 |
| |
|
Specially Controlled Infectious Waste |
ton |
- |
7 |
| |
|
Specially Controlled Strong Acid |
ton |
- |
0.4 |
| |
|
Specially Controlled Strong Alkali |
ton |
- |
0.02 |
| |
Recycling |
ton |
1,339 |
1,658 |
| |
|
Glass, Concrete, and Ceramic Waste |
ton |
- |
593 |
| |
|
Metal Scrap |
ton |
- |
139 |
| |
|
Wastepaper |
ton |
- |
348 |
| |
|
Sludge |
ton |
- |
31 |
| |
|
Waste Acid |
ton |
- |
5 |
| |
|
Waste Alkali |
ton |
- |
8 |
| |
|
Waste Oil |
ton |
- |
10 |
| |
|
Waste Plastics |
ton |
- |
176 |
| |
|
Wood Waste |
ton |
- |
340 |
| |
|
Electronic and Electrical Waste |
ton |
- |
8 |
| |
Valuable Materials |
ton |
1,404 |
1,252 |
| Recycling Rate (*2) |
46% |
48% |
(*1) The calculation of waste by category began in FY2024. Accordingly, the data for FY2023 are disclosed based on the disposal method.
(*2) The figure is calculated including valuable materials and excluding the amount of thermal recycling.
Water Withdrawal
| Water Sources |
Unit |
FY2023 Results (*3) |
FY2024 Results |
| Tap Water / Industrial Water |
thousand m3 |
- |
272 |
| Surface Water |
thousand m3 |
- |
0 |
| Seawater |
thousand m3 |
- |
0 |
| Groundwater |
thousand m3 |
- |
128 |
| Total |
thousand m3 |
433 |
400 |
(*3) The aggregation of water withdrawal by source began in FY2024. Accordingly, only the total amount is disclosed for FY2023.
Progress on GHG Emissions and Reduction Targets
PHC Group has set targets to reduce Scope 1 and Scope 2 GHG emissions by 42% and Scope 3 emissions by 25% by FY2030. These targets have been certified by the Science Based Targets initiative (SBTi) as 1.5°C-aligned targets consistent with the SBTi standards and the Paris Agreement.
In FY2024, Scope 1 and 2 emissions totaled 53,396 t-CO2e, representing a 1.4% reduction compared to FY2023. Scope 3 emissions (categories subject to reduction) totaled 732,643 t-CO2e, marking a 2.6% increase from FY2023. This increase is primarily attributable to higher emissions associated with Purchased Goods and Services, Upstream Transportation and Distribution, and the Use of Sold Products.
PHC Group will continue to advance initiatives aimed at achieving our FY2030 targets, while striving for sustainable growth and enhanced corporate value.
| Scope |
FY2030 Target |
FY2023 Results (Base Year) |
FY2024 Results |
Vs. Base Year |
| Scope 1 + 2 |
42% reduction |
54,154 |
53,396 |
-1.4% |
| Scope 3 (Categories subject to reduction: 1,4,6,11,12) |
25% reduction |
714,240 |
732,643 |
+2.6 % |
(Unit:t-CO2e)